
Retinotopic cortical mapping as an objective functional monitoring tool of macular therapy
Allan Hummer1, Markus Ritter2, David Linhardt1, Anna Leodolter2, Michael Woletz1, Maximilian Pawloff2, Ursula Schmidt-Erfurth2, Christian Windischberger1
(1) Center for Medical Physics and Biomedical Engineering, Medical University of Vienna, Vienna, Austria
(2) Department for Ophthalmology and Optometry, Medical University of Vienna, Vienna, Austria
Introduction
In population receptive field (pRF) mapping, “receptive fields” are determined by using a computational model establishing connections between visually stimulated retinal regions and the corresponding areas in the visual cortex. In order to evaluate the potential of pRF mapping for monitoring macular dysfunction during therapy, we applied the method to patients with neovascular AMD (nAMD). Measurements were performed before and after a loading dose with 3 monthly intravitreal injections of ranibizumab (Lucentis®).
Methods
Imaging data of 20 patients (age: 75.3 ± 6.9 years; 14 female) were recorded at baseline and month 3 on a 3T TIM Trio/ 3T Prisma Fit scanner (Siemens Medical, Erlangen, Germany). Structural images were acquired using an MPRAGE sequence (TE/TR = 2.45/2100 ms, voxel size = 1mm3). The CMRR multiband-accelerated EPI sequence was employed for obtaining functional images (TE/TR = 36.2/1500 ms, multiband factor 2, 28 slices, voxel size = 1mm3, 224 scans). Patients were instructed to fixate a small central dot, while amonochrome flickering checkerboard bar (8 Hz, width 2.35°) was moving across the screen (total width 18.8°) in eight different directions. Two to four runs were recorded per participant and session and subsequently concatenated. Slice-timing correction, realignment and smoothing with a 2mm FWHM kernel was performed using SPM12 (Wellcome Trust Centre for Neuroimaging, London, UK), while segmentation of anatomical data was performed with Freesurfer. Grey matter voxels were then used in the analysis were the pRF model proposed by Dumoulin and Wandell (2008) was fitted to the data using mrVista (Stanford University, Stanford, CA).
Patients also underwent a full ophthalmic examination as well as Best-corrected visual acuity (BCVA) assessments and Spectral domain optical coherence tomography (SD-OCT) at month 1, 2 and 3.
For quantitative analysis of the cortical activity in relation to BCVA, patients were divided into BCVA responders (significant increase of ≥ 5 letters at month 3) and non-responders.
Results
Figure 1 shows the results of an exemplary patient, with clear resolution of intraretinal fluid accompanied by a marked increase in BCVA after therapy. Functional MRI analysis demonstrates a corresponding increase in V1 cortical activity, showing twice as many active voxels representing sub and parafoveal function at month 3 compared to baseline.
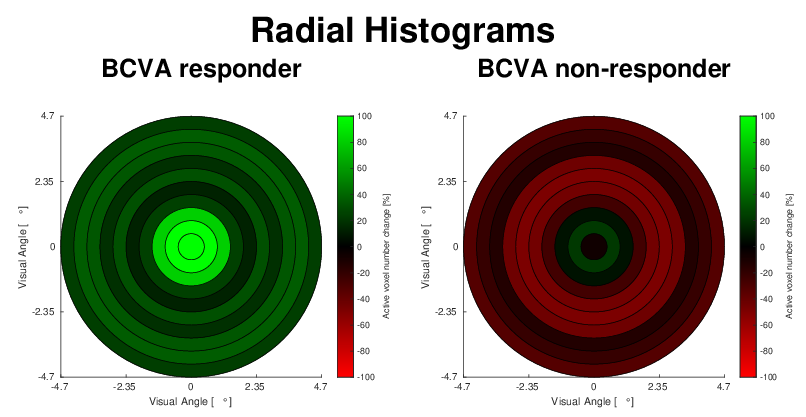
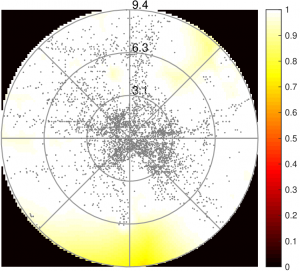
In order to visualise the difference of active voxels numbers when comparing baseline and month 3 runs over all subjects, data were combined and visualised through a histogram in visual field space. The inner 9.4° visual angle were separated into nine concentric annuli and a central disk. The relative change of suprathreshold pRF centre voxel numbers inside these annuli were then compared over all patients. The respective visual field space histograms for responders and non-responders are shown in Figure 2. While responders see an improvement of active voxel numbers after therapy, especially in central regions, the non-responders histogram shows a slight decline in all annuli, except the most central one.
The median of relative differences in the number of active V1 voxel between baseline and month 3 in the group BCVA responders is 29.5%, while it amounts to -0.8% in the group of non-responders.
Conclusion
We present a comparison between pRF mapping, psychophysical assessment and structural imaging in a group of nAMD patients before and after antiangiogenic therapy, and quantifies treatment response of macular therapy at the level of the visual cortex. Our results demonstrate retinotopic improvement in patients with nAMD after therapy, reflected by increased response of the visual cortex and therefore clearly show that fMRI is applicable in patients suffering from nAMD and offers objective assessment of treatment response. This demonstrates the potential of retinotopic mapping to serve as an objective outcome measure to augment clinical evaluations.
FMRI reveals anterior V1 activation in a retinitis pigmentosa patient
Allan Hummer1, Markus Ritter2, David Linhardt1, Anna Leodolter2, Michael Woletz1, Maximilian Pawloff2, Ursula Schmidt-Erfurth2, Christian Windischberger1
(1) Center for Medical Physics and Biomedical Engineering, Medical University of Vienna, Vienna, Austria
(2) Department for Ophthalmology and Optometry, Medical University of Vienna, Vienna, Austria
Introduction
Population receptive field (pRF) mapping not only allows for characterising visual cortex function in healthy subjects, but also for investigating pRF alterations associated with disorders of the visual system. Recently, we showed the correspondence of pRF mapping, microperimetry (MP) and spectral domain optical coherence tomography (SD-OCT) in a retinitis pigmentosa (RP) cohort [1]. Although the modalities correlated well, pRF mapping seemed to overestimate the patients’ remaining peripheral visual field coverage. Therefore, we acquired additional data in the patients of [1] to investigate cortical activation patterns related to peripheral stimulation.
Methods
At the first visit, RP7 (age: 43 years; female) was measured on a 3T Trio scanner (Siemens Medical, Erlangen, Germany). The CMRR multiband sequence (TE/TR=36/1500ms, multiband 2, 28 slices, voxel size=1mm3, 336 scans) was used to acquire functional images, while a structural volume was recorded with the use of a MPRAGE sequence. The visual stimulus consisted of a flickering bar crossing the screen (total width 18.8° visual angle) in eight different directions. Preprocessing consisted of slice timing correction, realignment and 2mm FWHM smoothing, which was performed with SPM12 and white matter (WM)/gray matter (GM) segmentation with Freesurfer. pRF estimation was performed using mrVista. The subject also underwent SD-OCT using a Spectralis HRA & OCT system and MP consisting of 41 stimuli (12° × 12°) using a MP-1 microperimeter. At the second visit RP7 was scanned on the upgraded 3T Prisma FIT. Sequence parameters were identical to the first visit. However, additional of a travelling bar, a centre-surround stimulus was shown (195 scans). As the scotoma border was estimated at 3.5° visual angle based onMP, the stimulus consisted of a central disk (<2.5° radius) and a ring (>4.5° radius), which alternately exposed a reversing checkerboard for 9.75 seconds. To analyse the centre-surround data a GLM analysis was performed in SPM12. During fMRI measurements, an eyetracker monitored gaze stability.
Results
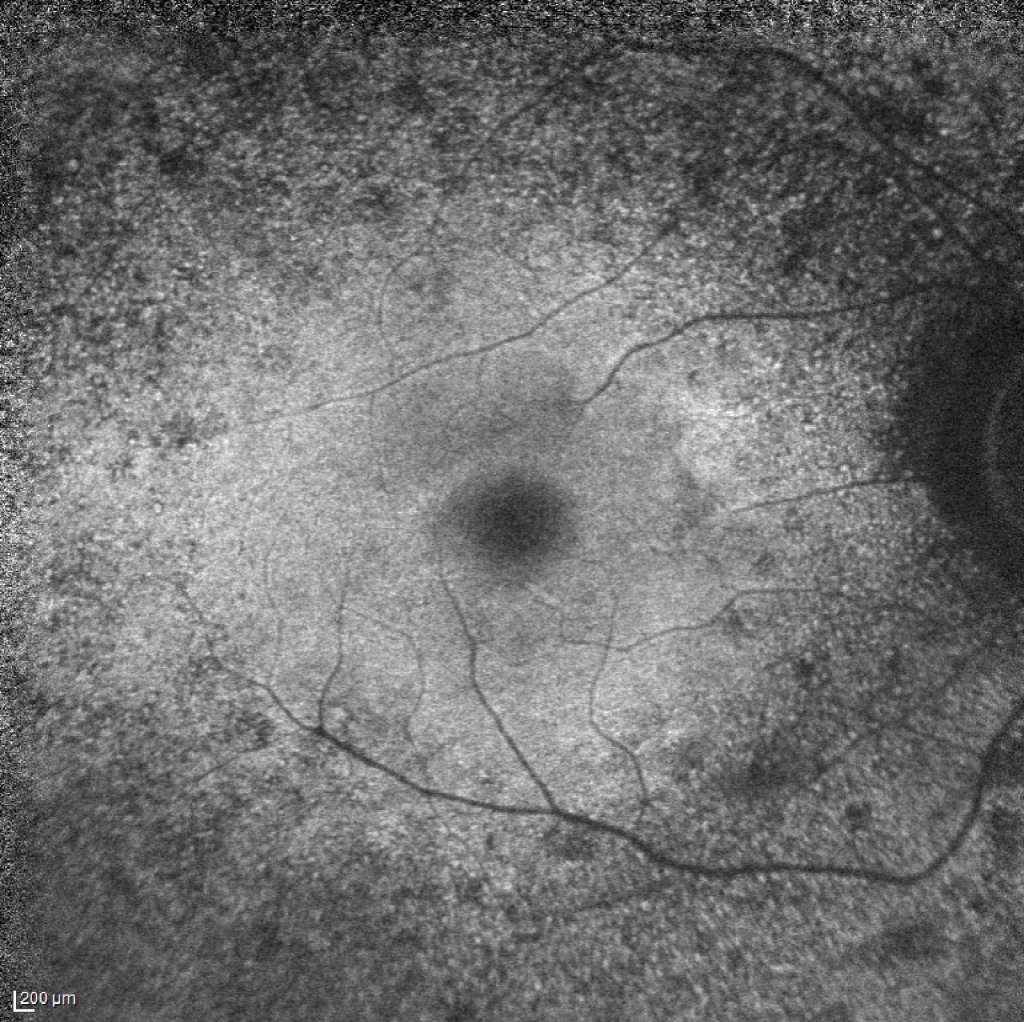
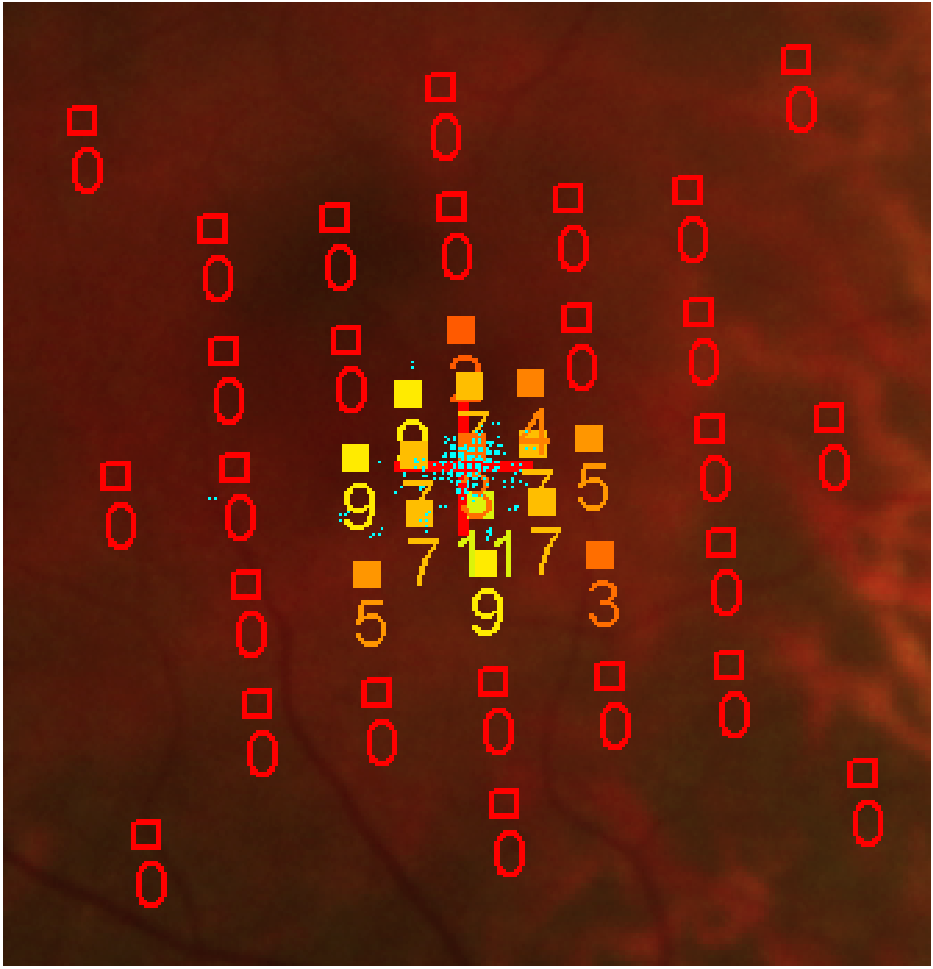
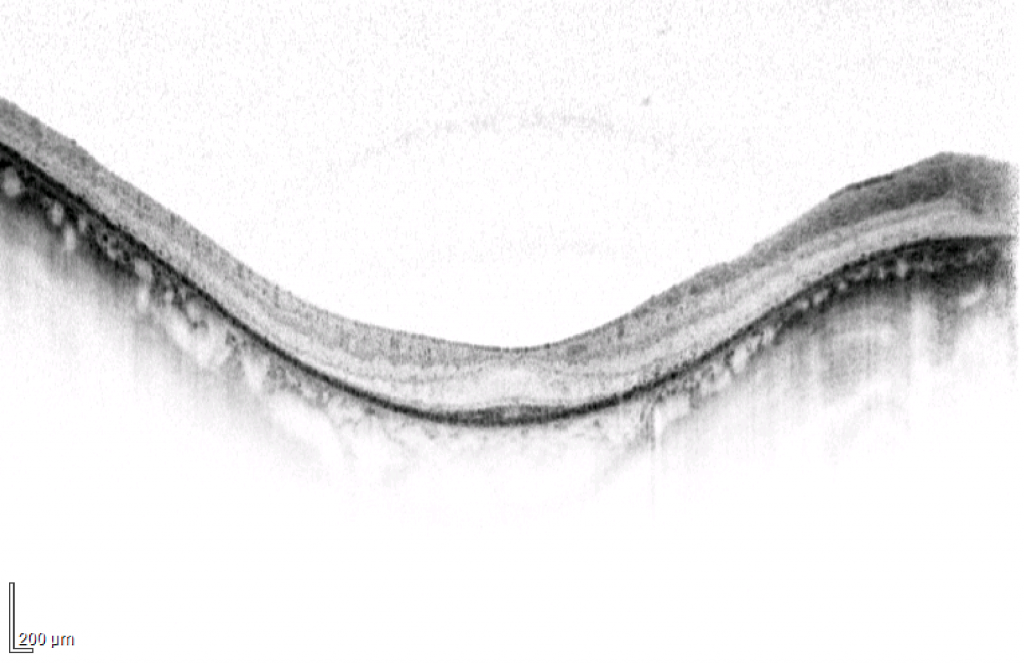
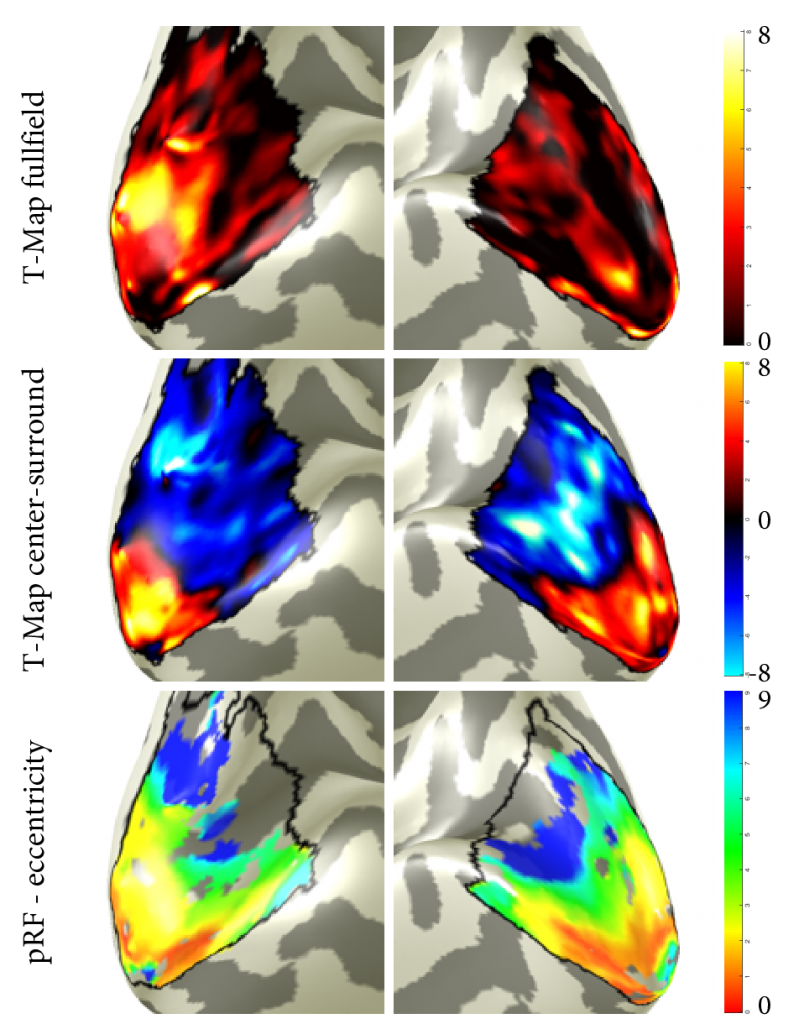
A fundus autofluorescence, a central SD-OCT B-scan and MP results are displayed in Figure 1. SD-OCT of the subject shows severe extrafoveal loss of outer retinal layers. MP shows considerable loss of peripheral retinal sensitivity. The maps resulting from the GLM analysis of the fullfield stimulation, as well as the centre-surround run are displayed in Figure 2. Further, eccentricity maps estimated from one single pRF mapping run are shown, overlaid on the inflated WM/GM surface inside V1. In figure 3, a corresponding pRF coverage map shows estimated pRF centres at eccentricities where retinal structure and function is considerably impaired according to SD-OCT and MP. In the centre-surround contrast, positive t-values correspond to activation related to central stimulation while negative values are related to peripheral stimulation. T-values smaller/larger than -5.13/5.13 correspond to p<0.05.
Conclusion
Although SD-OCT and MP predict a complete loss of vision in areas larger than 3.5°, corresponding visual cortex areas showed well-preserved activation in both, pRF mapping and centre-surround runs. Methodological differences could explain the mismatch of MP and pRF mapping. In contrast to MP, which samples a limited number of retinal locations using brief light flashes, a continuously flickering checkerboard is shown during pRF mapping, covering larger retinal areas. PRF maps are also influenced by fixation instability. However, eyetracker recordings confirmed stable gaze fixation. Additionally, pRF maps show the expected patterns and centre- surround results display clearly separated functional areas corresponding to central and peripheral stimulation. Reproducibility of these findings will be assessed in additional RP patients to see if a fundamental disparity of MP and pRF mapping exists when characterising retinal function.