
Towards objective scotomata assessment using fMRI-based retinotopic mapping: a connectomic approach
David Linhardt1, Maximilian Pawloff2, Michael Woletz1, Martin Tik1, Maria Vasileiadi1, Markus Ritter2, Ursula Schmidt-Erfurth2, Christian Windischberger1
(1) Center for Medical Physics and Biomedical Engineering, Medical University of Vienna, Vienna, Austria
(2) Department for Ophthalmology and Optometry, Medical University of Vienna, Vienna, Austria
Introduction
Assessment of neural function on the visual cortex by retinotopic fMRI allows for mapping the functional status of an individual’s visual field. Population receptive field (pRF) mapping is of particular interest in patients suffering from diseases that cause dysfunctions in the retina referred to as scotomata (Ritter et al., 2018). The critical point in pRF-based scotomata assessment lies in setting the threshold between activated and non-activated voxel. Current gold standards use static thresholds based on the explained variance and may lead to under- or overestimation of scotomata extend. Here we present a new method based on reference data from the Human Connectome Project (HCP) that enables automatic scotomata assessment independent of threshold levels.
Methods
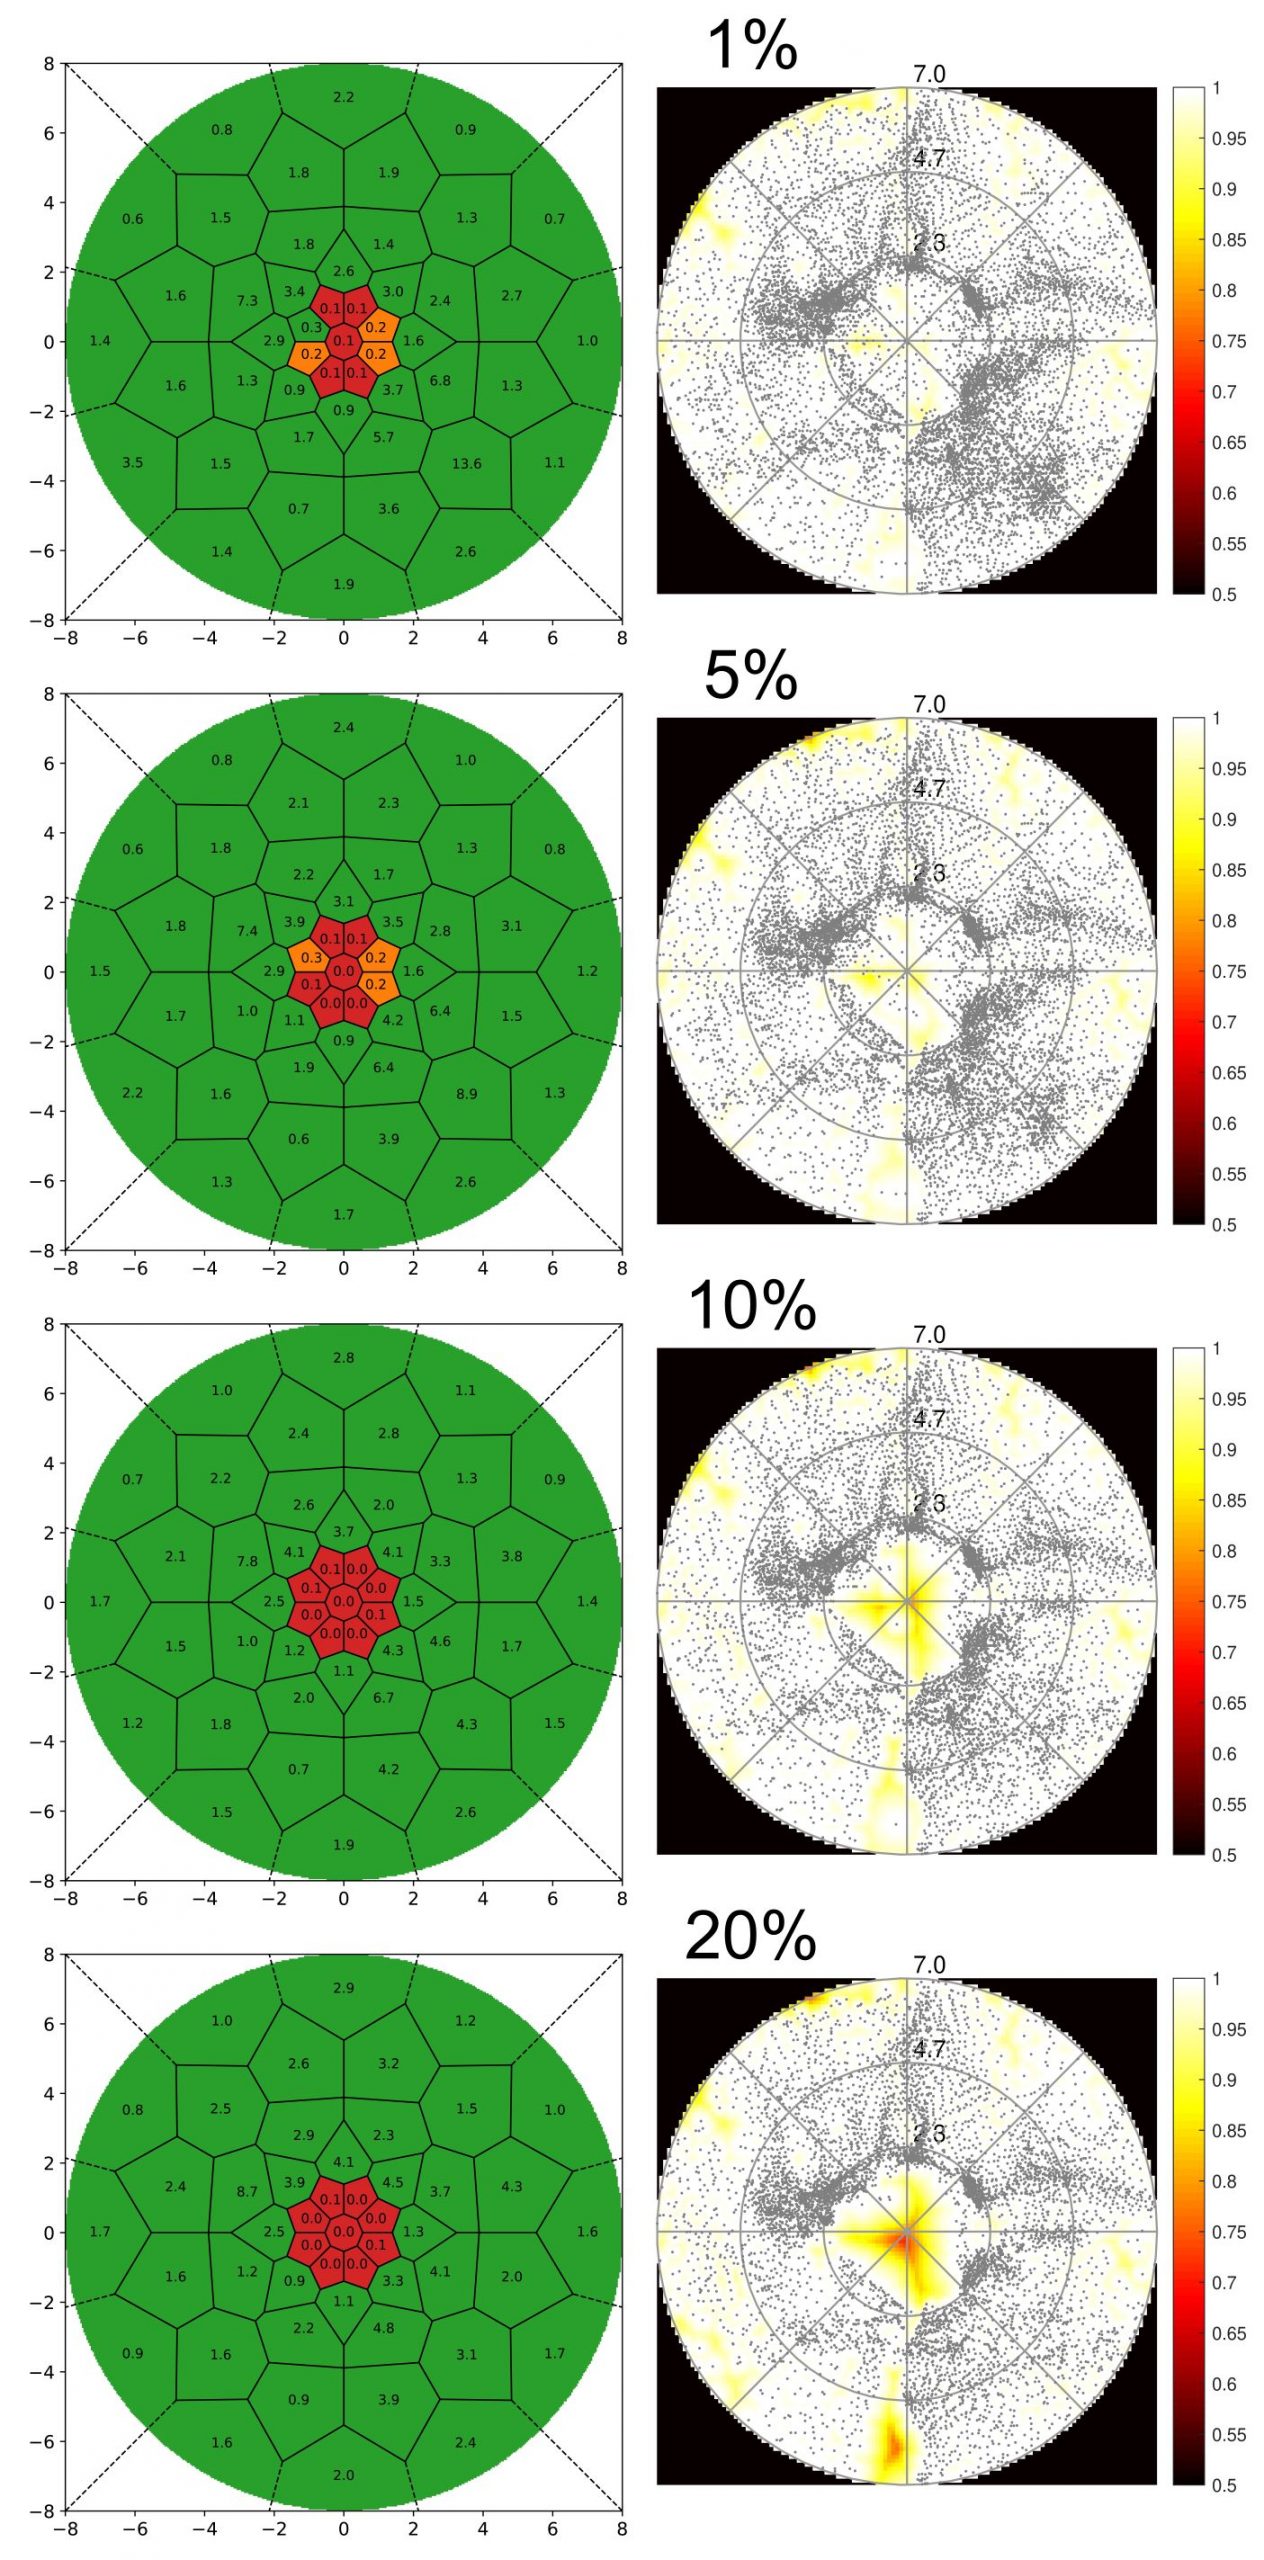
Functional classification is based on the comparison of individual pRF mapping results to group reference data. For this, the HCP retinotopy dataset (Benson et al., 2018) is perfectly suited since it contains 181 healthy subjects measured on a 7T scanner. For comparability, we re-analysed the HCP data using mrVista and restricted the analysis to the primary visual cortex. We defined a grid across the visual field and for every corresponding grid-points area, we quantified the number of pRF centres relative to the total number of active centres to obtain a subject-specific map of pRF centre density. For each grid area we calculated a distribution of centre density across the 181 HCP subjects. Based on these distributions, we defined three levels in the classification process: fully functional (above the 5% percentile; green), dysfunctional (below 0.1% of HCP average density; red), partly functional (in between; orange).
We tested our implementation on data of 20 healthy subjects with simulated scotomata acquired on our 7T Siemens scanner using a 32-channel head coil. Additional to a T1-weighted anatomical scan (0.7mm isotropic), functional data of the visual cortex was acquired using the CMRR-EPI sequence (TR=2000ms, 1mm isotropic, 32 slices). For each subject, data consisted of a single run of a bar aperture revealing a reversing checkerboard, sweeping through the visual field in eight different directions. A central area of 2° radius was not stimulated to simulate a foveal scotoma. In addition, one patient suffering from Stargardt’s disease was also analysed using the HCP control repository.
Results
Figure 1 shows the results of one healthy subject for different explained variance thresholds. The right column displays the standard coverage map, while results of the new scotomata assessment method are shown in the left column. It can be seen that while coverage maps change considerably across threshold levels, maps calculated with the new method show perfect classification results for thresholds above 5%. Even at 1% threshold, the new method clearly shows the central scotoma at 2° radius.
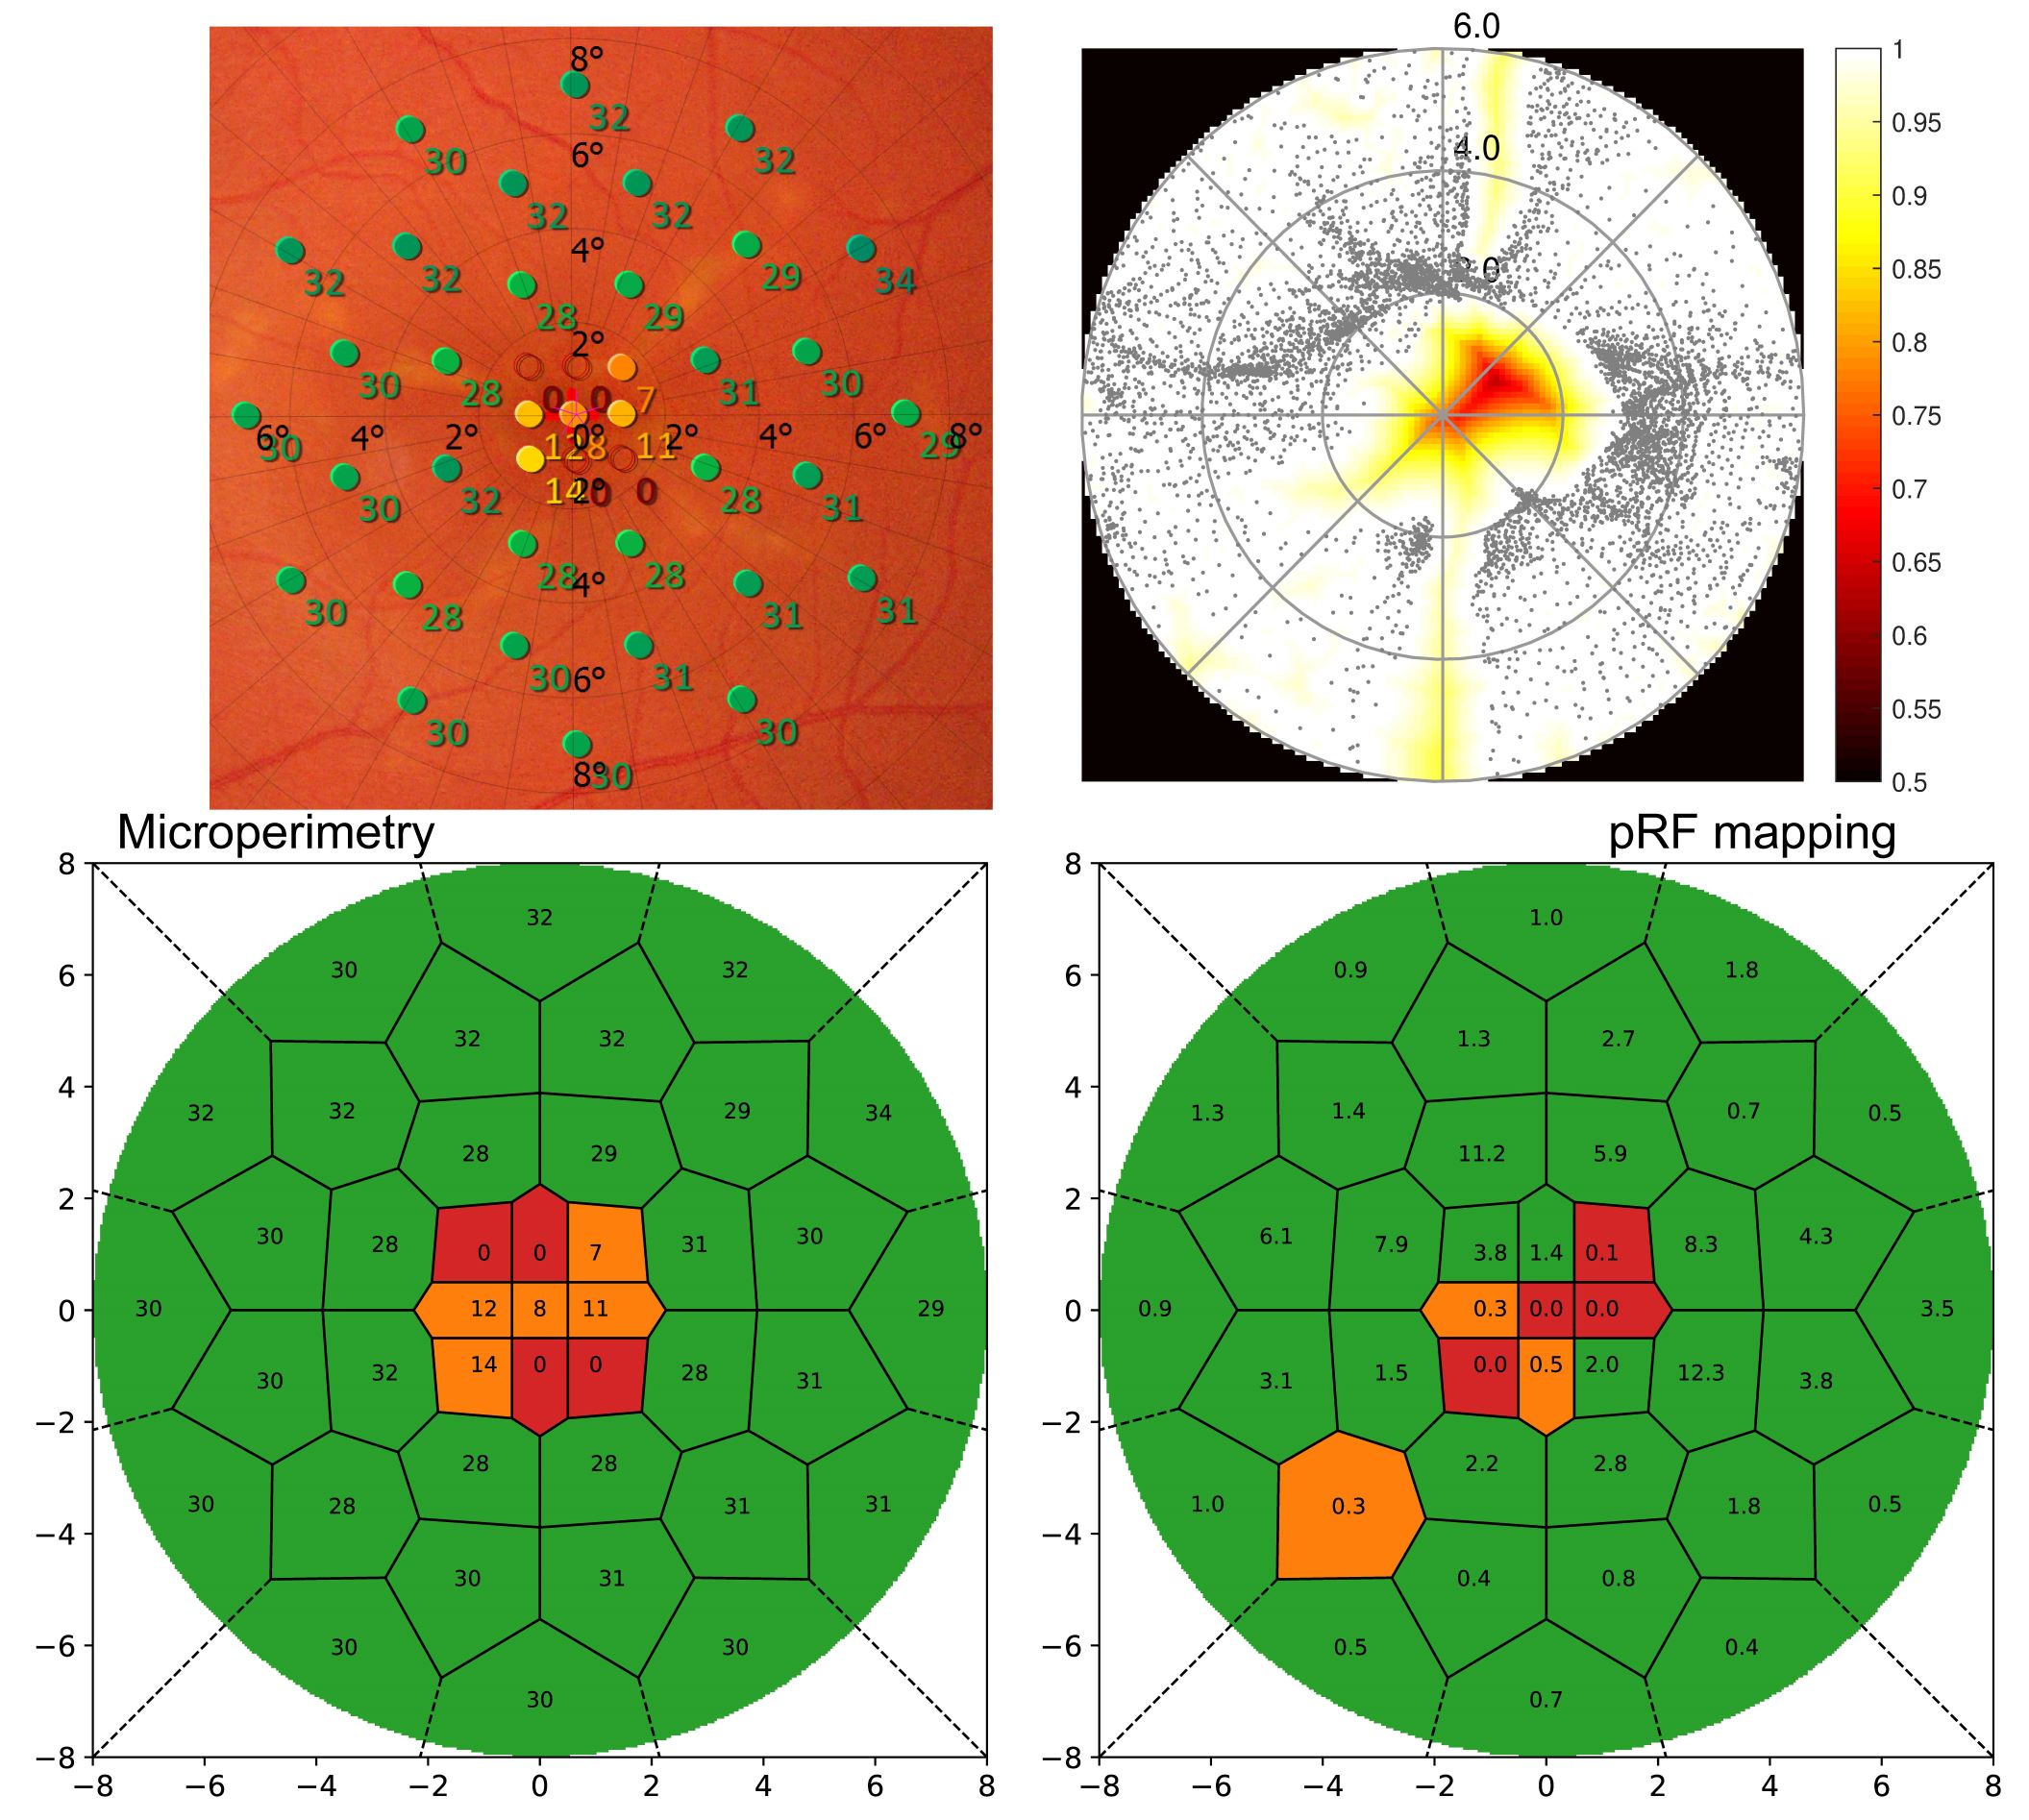
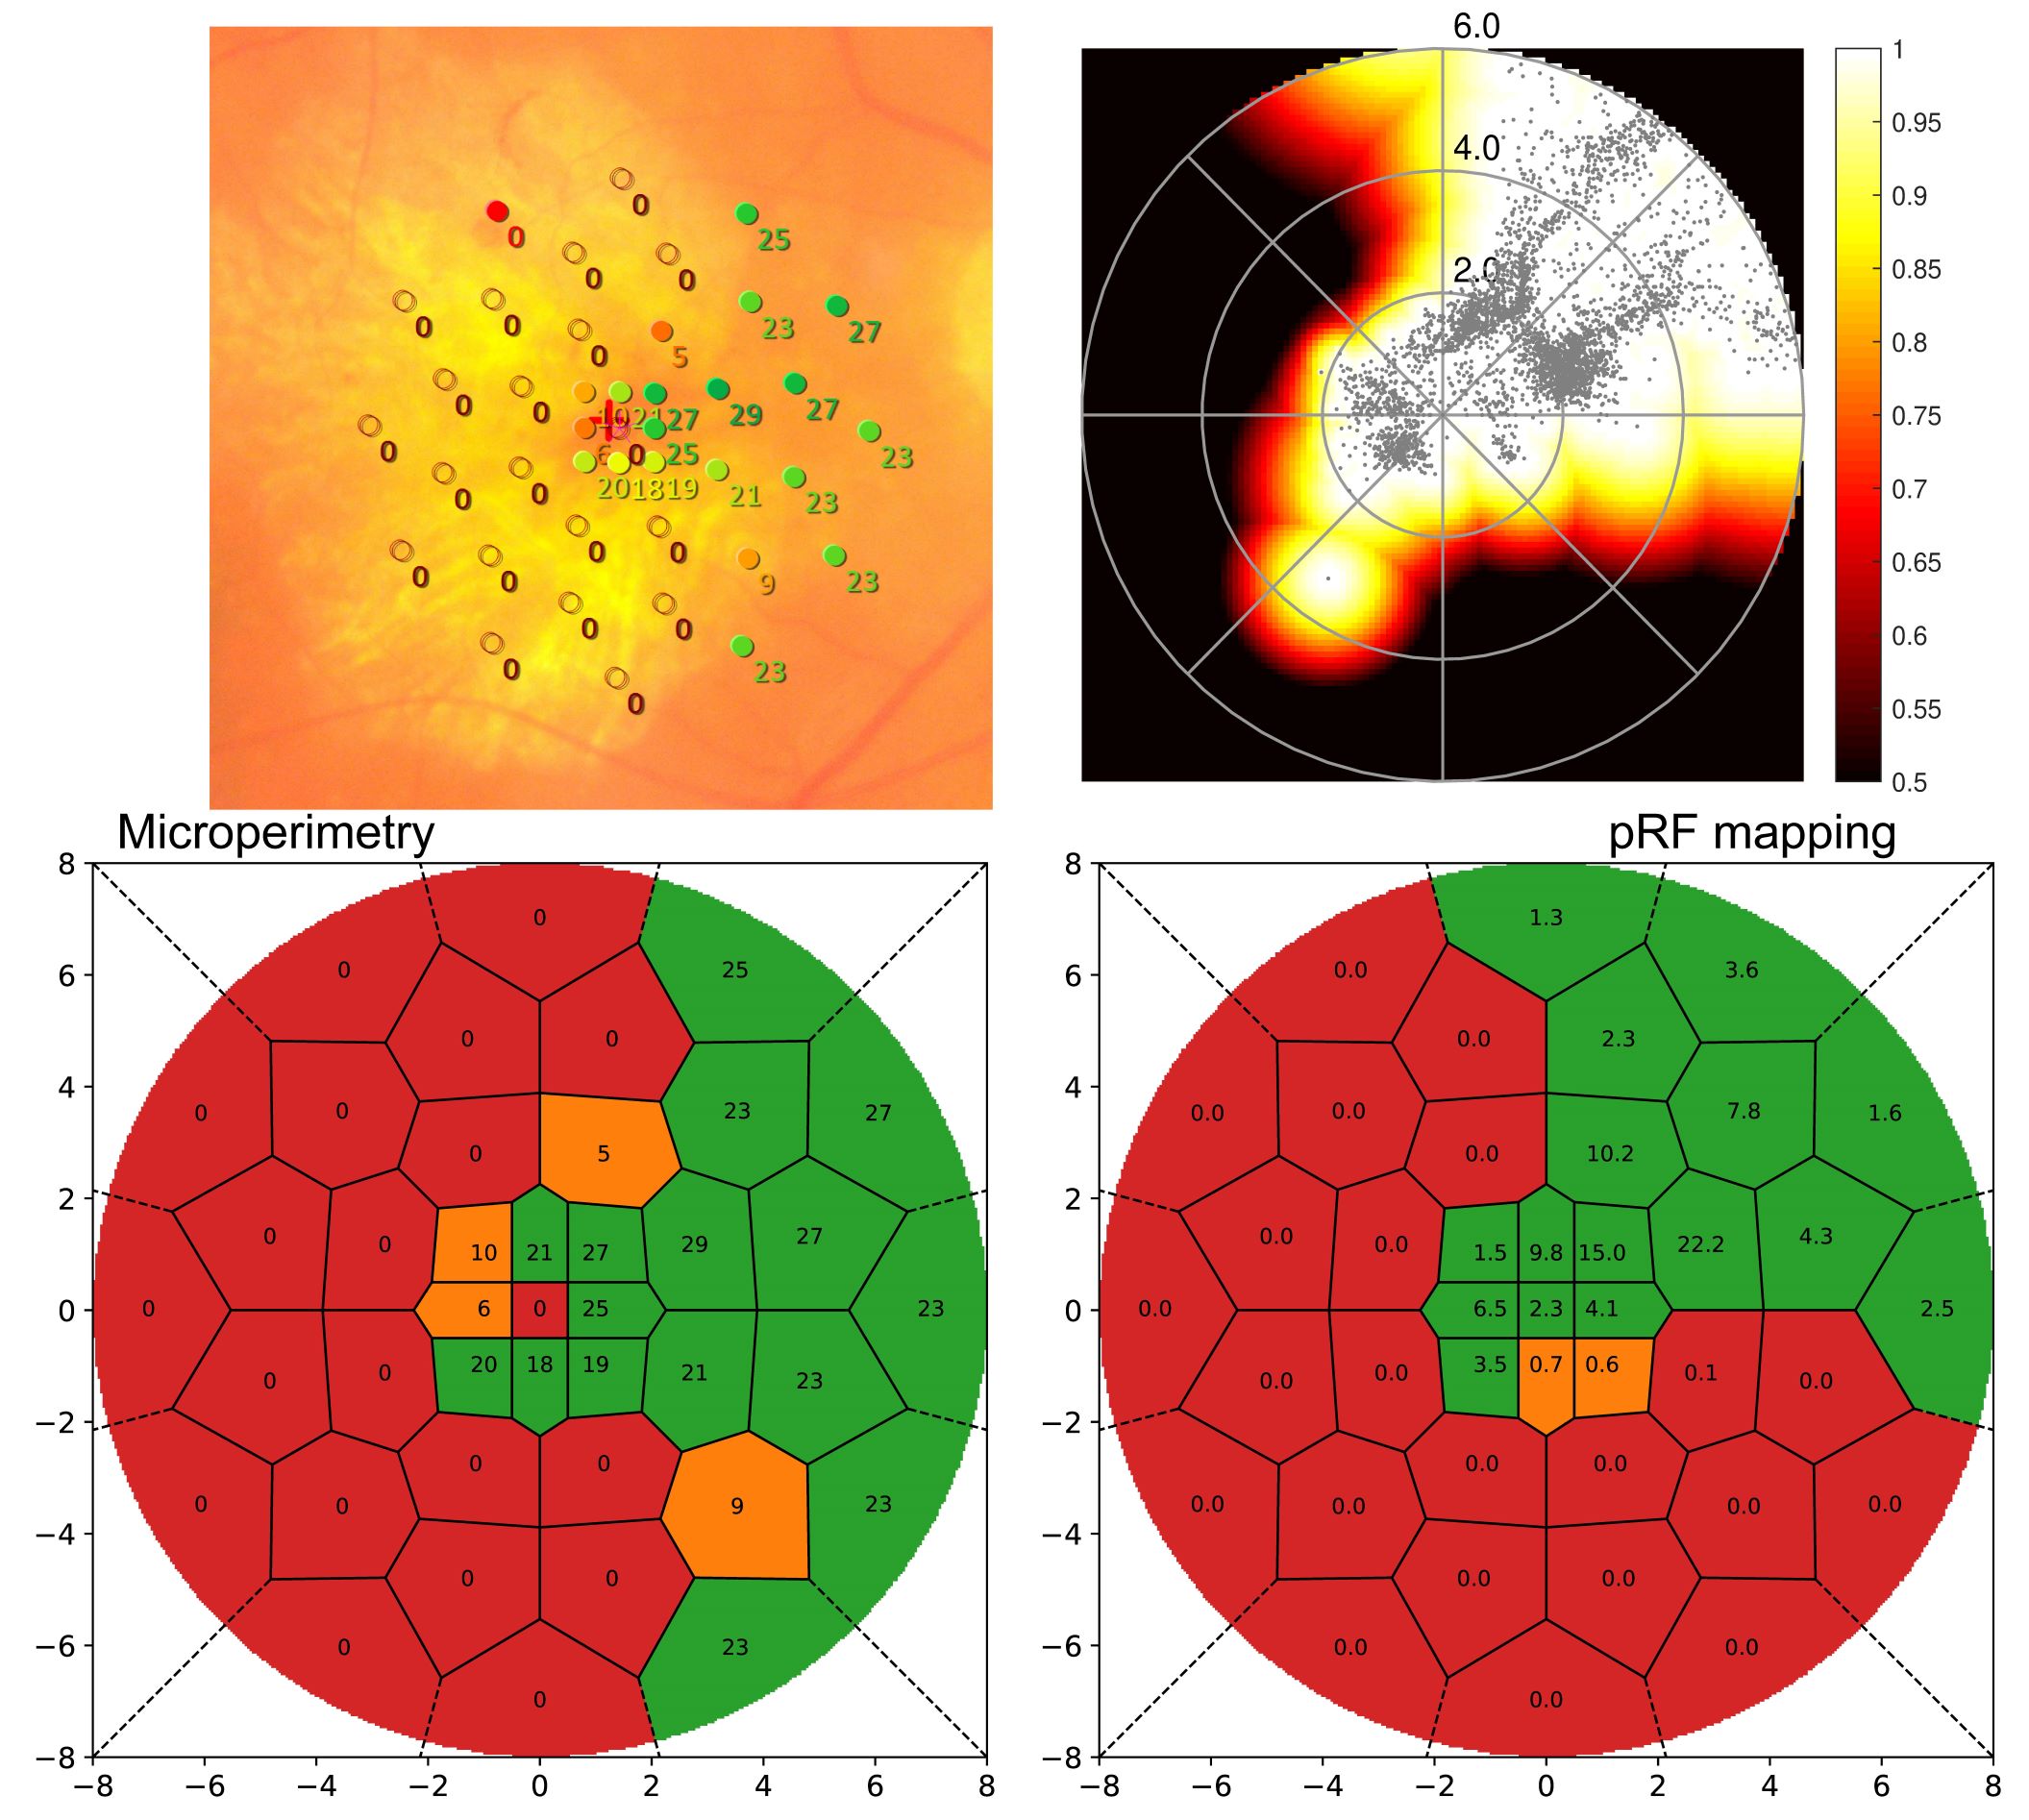
As the method was developed to quantify scotomata in patients with retinal disease, Figure 2 displays results from a Stargardt’s disease patient. Microperimetry (MP) results from clinical examination are shown (left) overlaid to a fundus image and rated. On the right side, the standard pRF coverage map is shown along with the novel classification result. For optimal comparability between retinotopy and ophthalmology results, the grid used in MP was also applied to the pRF results. Other than the standard coverage plot, the new method shows clear scotomata results comparable to the MP outcome.
Conclusion
When interpreting pRF mapping results on patients with retinal dysfunctions, the choice of the appropriate variance-explained threshold has a tremendous influence on scotomata detection making objective ophthalmologic staging on pRF results almost impossible. The herein suggested procedure yields the possibility for an unbiased investigation of the dynamics of scotomata independent of the chosen threshold and on flexible grids which can be adapted to MP results.
Intra- and inter-session reproducibility of artificial scotoma pRF mapping results at ultra-high fields
David Linhardt1, Maximilian Pawloff2, Allan Hummer1, Michael Woletz1, Martin Tik1, Maria Vasileiadi1, Markus Ritter2, Ursula Schmidt-Erfurth2, Christian Windischberger1
(1) Center for Medical Physics and Biomedical Engineering, Medical University of Vienna, Vienna, Austria
(2) Department for Ophthalmology and Optometry, Medical University of Vienna, Vienna, Austria
Introduction
Population receptive field (pRF) mapping methods allow for the assessment of visual field dysfunctions from retinal diseases through fMRI measurements of the visual cortex. While fMRI studies at ultra-high magnetic fields offer increases in sensitivity, artefacts from magnetic field inhomogeneities, dural veins and motion may also increase and pose considerable challenges requiring adequate compensation strategies. In order to translate pRF-based mapping to clinical applications, it is paramount to quantify reliability and robustness within and across sessions. To do so, we herein assessed intra- and intersession reliability of scotomata detection at 7T in healthy participants using artificial scotomata.
Methods
All experiments were performed on a 7T Siemens MAGNETOM scanner using a 32-channel head coil. A total of 20 healthy subjects (age:25.8±3.7, 9 female) without a history of significant eye diseases were recruited and underwent a standard clinical examination. Functional data were acquired at 1mm isotropic resolution, using the CMRR-EPI sequence (TR/TE=2000/25.2ms, flip angle=70°, slice gap=0.1mm) and the acquisition was limited to 32 slices placed at the occipital lobe, perpendicular to the calcarine sulcus. Additionally, a T1-weighted MPRAGE full-brain anatomical scan was performed (0.7mm isotropic resolution) for white matter segmentation.
Participants were presented with a bar revealing a flickering checkerboard moving through the field of view in eight different directions, for a total of 356s per run. In order to simulate a scotoma, the stimulus was modified with a circular, blank area in the centre (2° radius). Subjects participated in two sessions containing two retinotopy runs each. The participants were instructed to fixate the central fixation dot and report colour changes to allow for attention assessment. Five subjects had to be excluded due to extensive movement (framewise displacement > 0.1mm) or below threshold (<85%) attention performance in at least one of their four runs.
Functional data pre-processing included slice-timing, realignment and distortion correction. Using white-matter segmentation obtained from freesurfer (https://surfer.nmr.mgh.harvard.edu/fswiki/recon-all), pRF analysis was performed in mrVista (https://web.stanford.edu/group/vista/cgi-bin/wiki/index.php/MrVista), with an input-stimulus containing no artificial scotoma.
Results
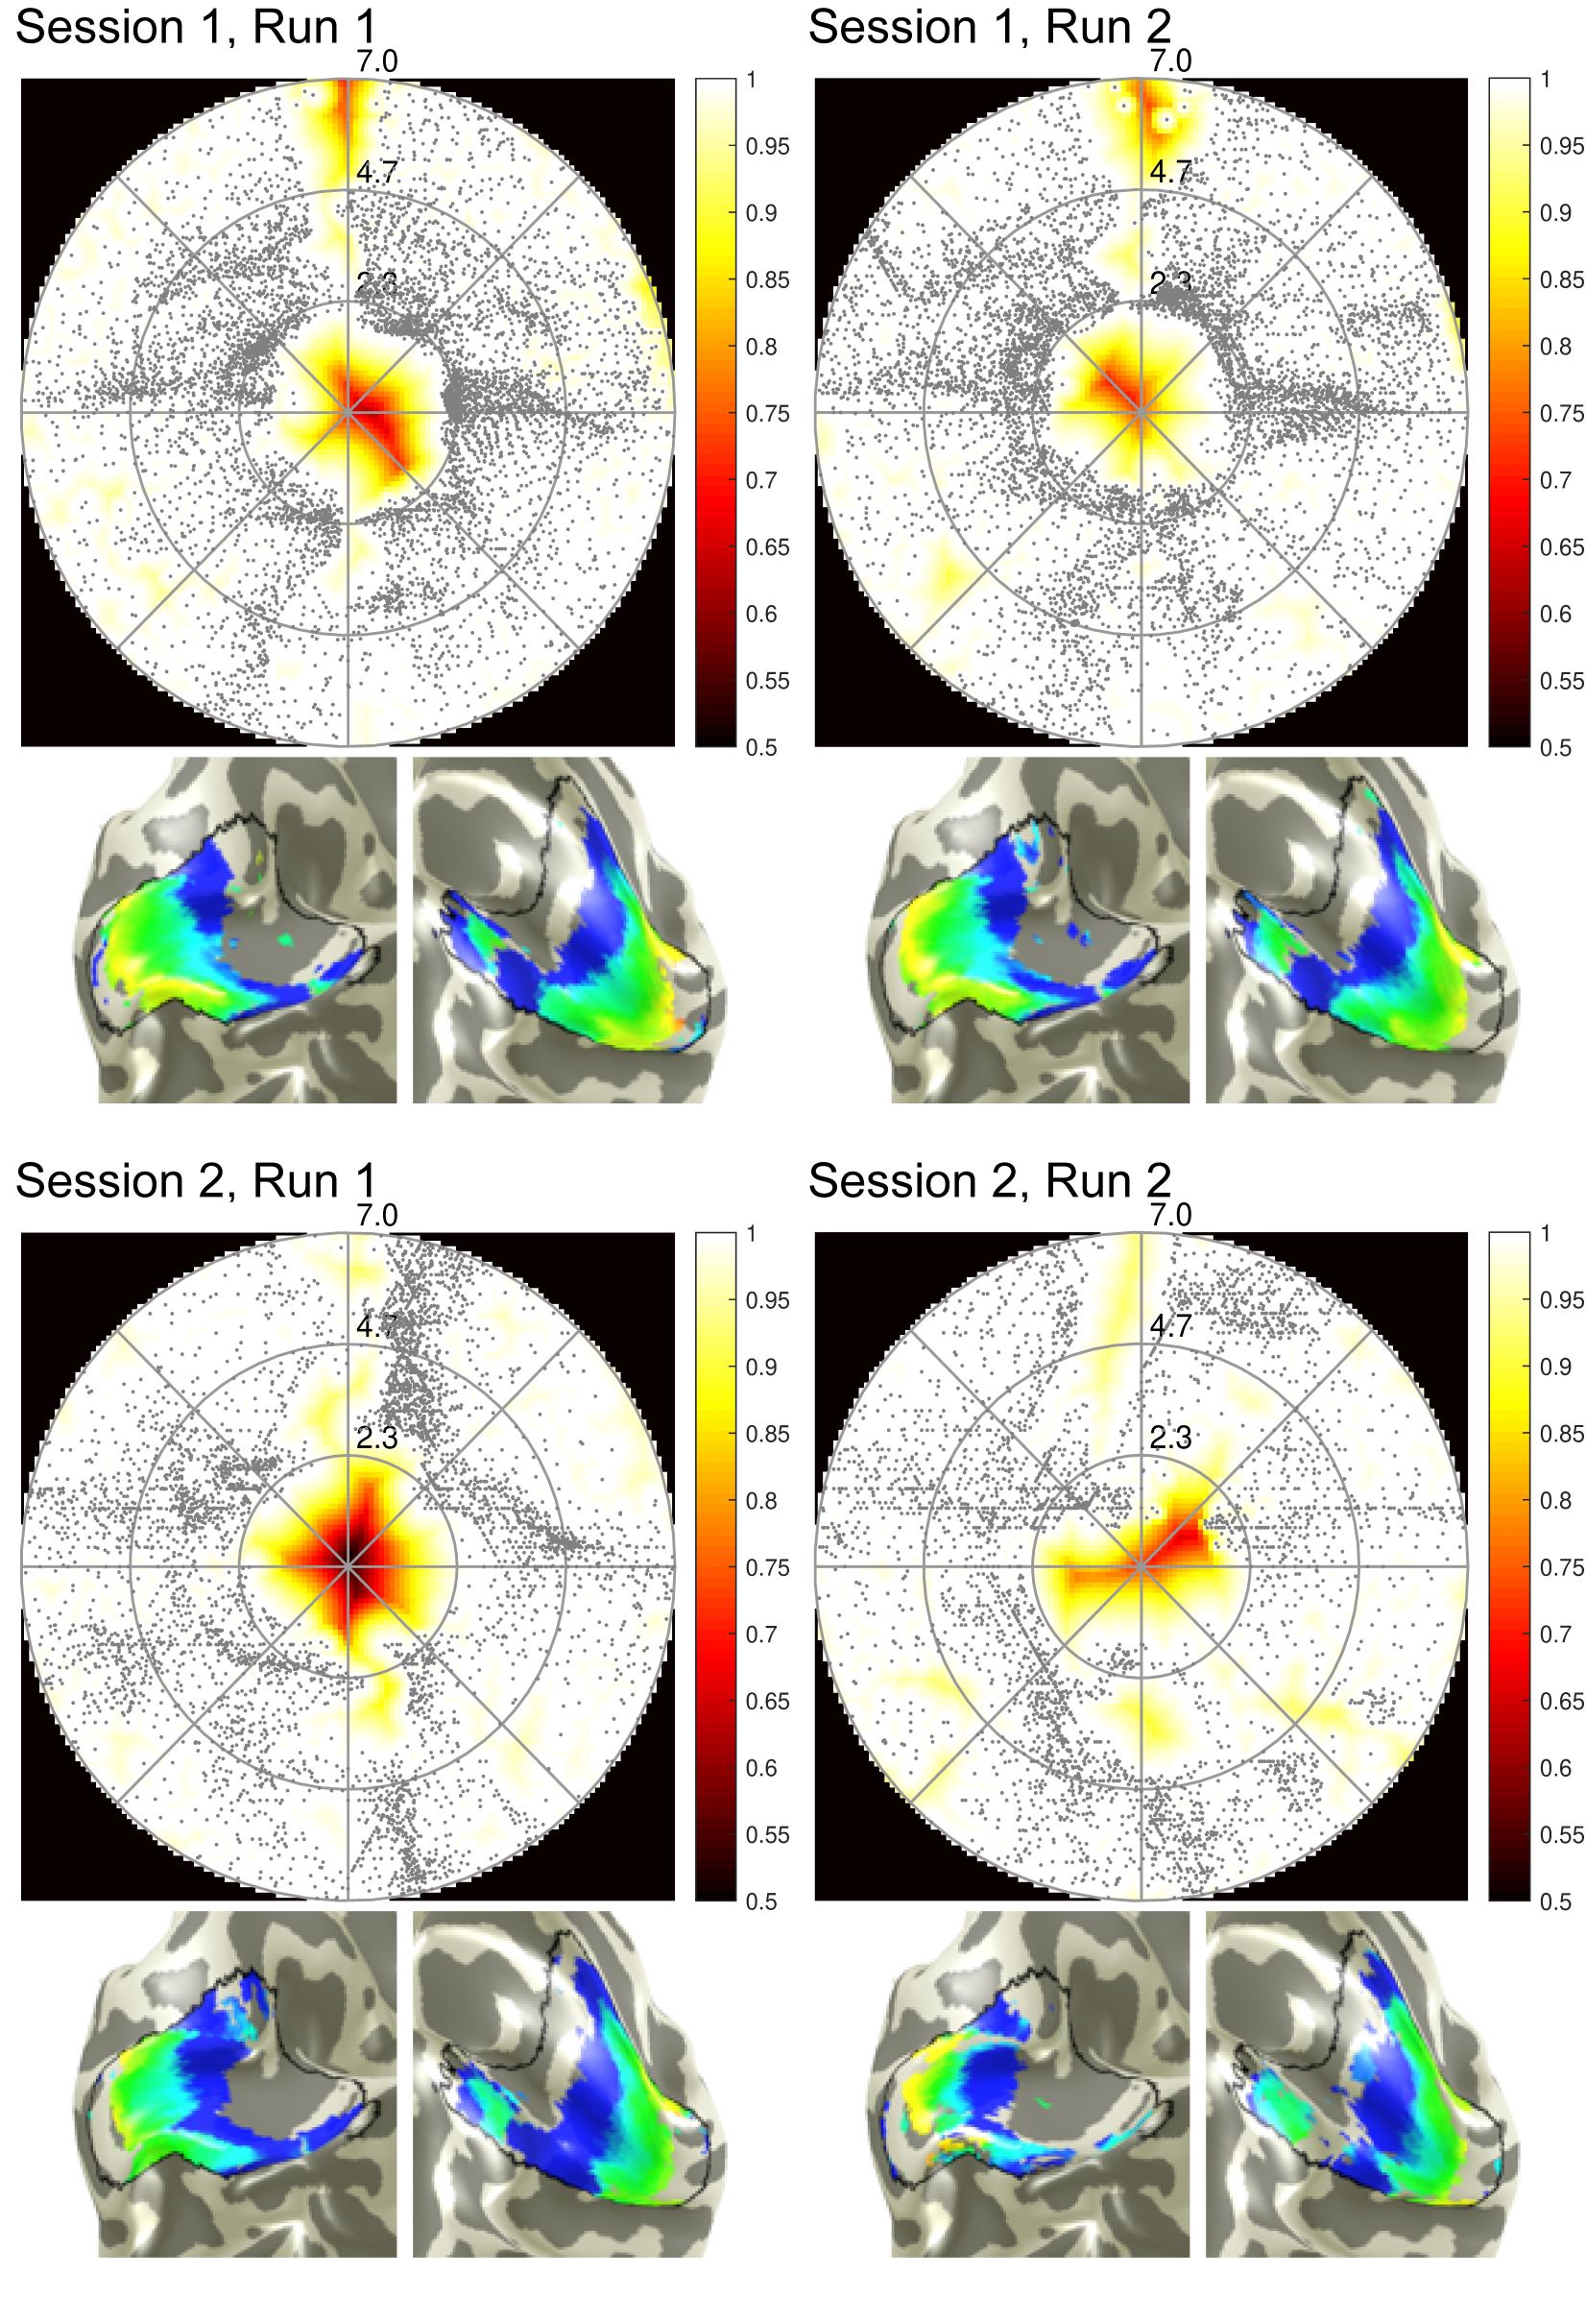
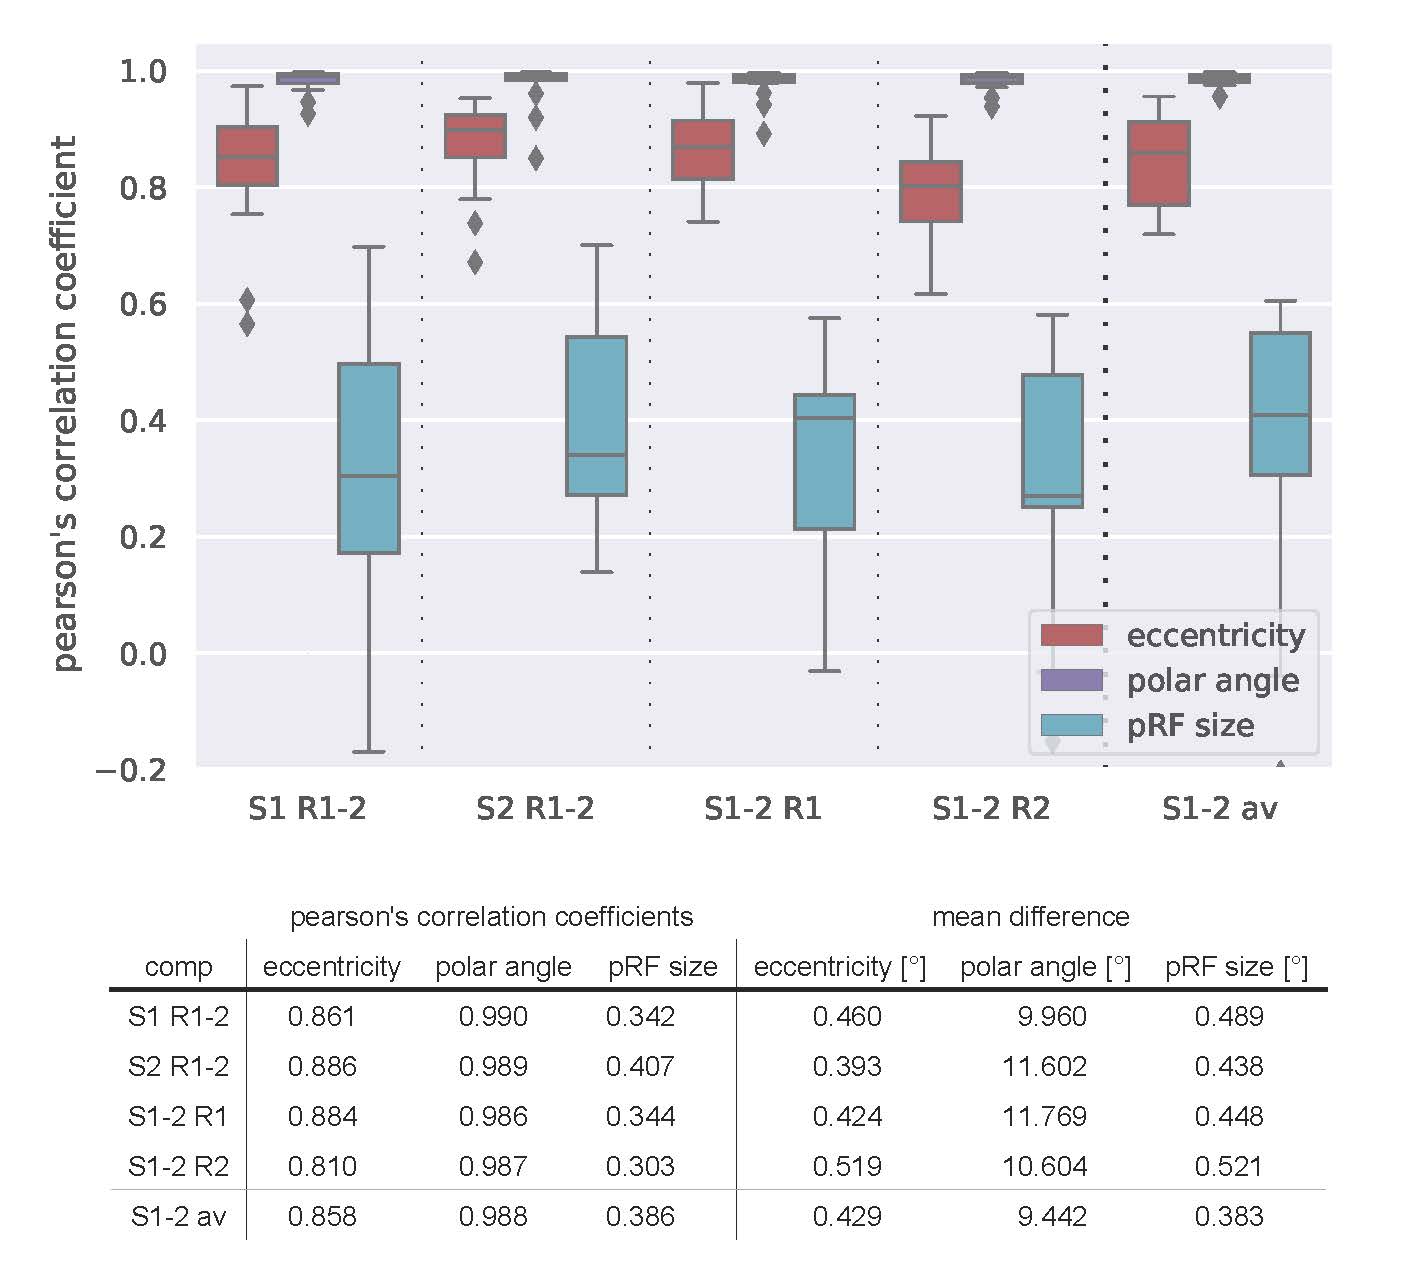
Figure 1 shows coverage and cortical eccentricity maps of an exemplary subject. Here, single-run results are shown for all four runs (two runs per session, 10% variance explained threshold). To obtain group-level results, Pearson’s correlation coefficient of between-run results were calculated for the three most important pRF parameters: eccentricity, polar angle and pRF size. The distribution across subjects of the calculated correlations are shown in Figure 2. Additionally, the runs were averaged within one session and then correlated between the sessions. The mean correlation values are printed in the Table Fig 2. It can be seen that pRF position parameters (eccentricity, polar angle) yield very high correlation coefficients in both intra- and inter-session comparison. However, the pRF size parameter shows lower (but still statistically significant) correlation coefficients that are again stable for intra- and intersession conditions. The correlation between averaged runs is not increased significantly compared to single-run results.
Conclusion
The evaluation of pRF method stability of artificial scotoma stimulation in healthy participants is essential to further develop the method towards wider and more reliable use in patients with scotomata. This work shows, that pRF mapping results highly correlate within one session as well as between sessions. The fact that the artificial scotoma stimulation does not affect the method’s reliability (compare with (van Dijk et al., 2016)) corroborates the possibility to use pRF mapping approaches in patients with retinal disorders and therefore opens new possibilities beyond conventional ophthalmologic methods.
Stimulus-specific biases in population receptive field mapping
prf_comparisonArtificial scotoma size estimation on high-resolution 7T retinotopy data
David Linhardt1, Maximilian Pawloff2, Allan Hummer1, Markus Ritter2, Michael Woletz1, Ursula Schmidt-Erfurth2, Christian Windischberger1
(1) Center for Medical Physics and Biomedical Engineering, Medical University of Vienna, Vienna, Austria
(2) Department for Ophthalmology and Optometry, Medical University of Vienna, Vienna, Austria
Introduction
Applying population receptive field (pRF) mapping methods [Dumoulin 2008] at ultra-high field MRI scanners yield the possibility for detecting visual field losses due to retinal pathologies. However, various artefacts including magnetic field inhomogeneities, subject compliance or the influence of dural venous sinuses, negatively influence the quality of analysis results. While it was previously shown that artificial scotoma sizes could be estimated by pRF analysis data at 3T [Hummer 2018], it is unclear to what extent BOLD sensitivity benefits at ultra-high field translate to scotoma detection accuracy. Here we apply two different pRF stimulation paradigms at 7T to assess and compare coverage map quality and scotoma estimation performance.
Methods
The experiment was performed on a 7T Siemens MAGNETOM scanner, using a 32-channel head coil. 18 subjects (age: 25.6±3.8; 9 female) were included in the study. Beforehand, the subjects were attested for good sight at the local ophthalmology department and had no history of eye diseases. EPI data was acquired with 1mm isotropic resolution using the CMRR multi-band sequence (TR/TE=2000/25.2ms, flip angle=70°, slice gap=0.1mm, LR phase-encoding direction). As usual in retinotopic studies, the acquisition is limited to the occipital lobe (32 slices). Additionally, to the functional runs, two short EPI sequences were measured for distortion correction as well as a full-brain, T1-weighted MPRAGE image for the white matter segmentation.
Inside the scanner, stimuli of reversing checkerboards were presented to the subjects using a projection screen fixed at the end of the patient table. The two different stimulation paradigms were (1) bars moving through the visual field in eight different directions and (2) a combination of rotating wedges and expanding and contracting rings [Engel 1994; Dumoulin 2008]. These stimuli were used for two runs of 356s each. In order to simulate central vision losses the stimuli were modified by a blank, unstimulated circle in the centre with a radius of 2° visual angle.
Processing of functional data included slice-timing, realignment and
distortion correction. Functional images and white matter segmentation data derived from the anatomical image were used as input for the pRF analysis suite mrVista. As the analysis input stimulus, the unmodified stimulus without artificial scotoma was used. For the combined results, bar/wedges and rings runs were concatenated.
Results
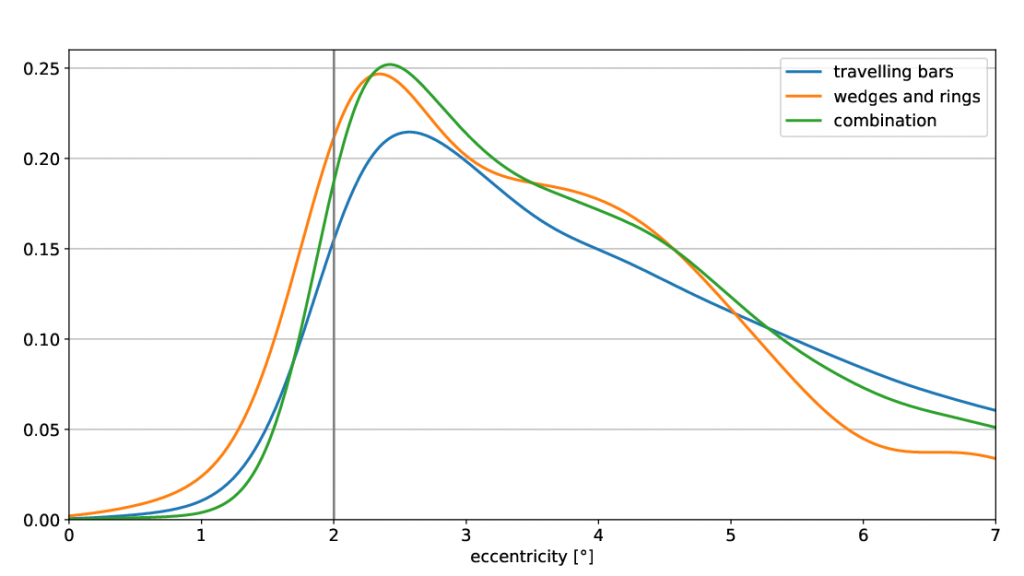
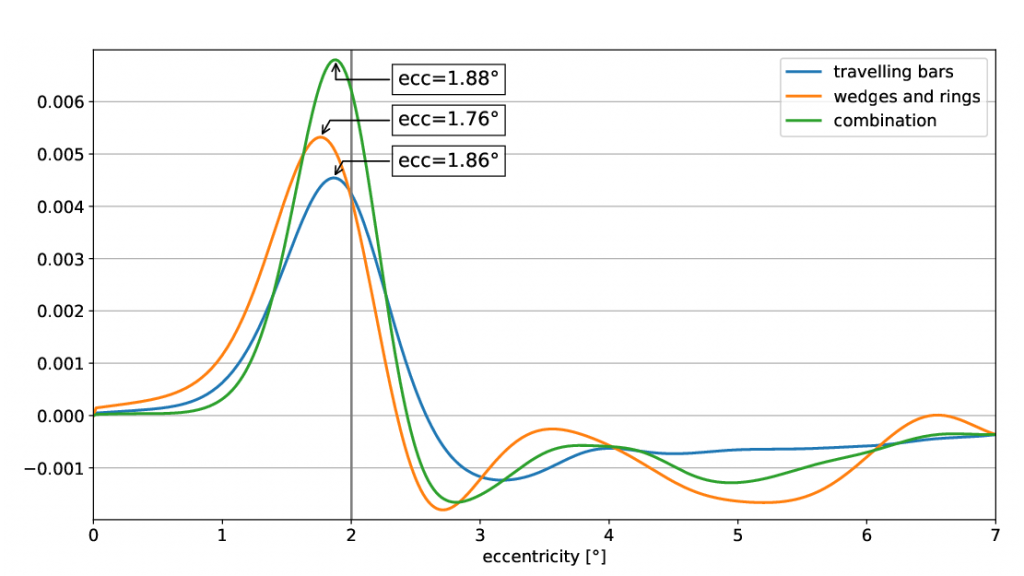
Visualisation of the visual field coverage maps as well as the visual cortex overlayed with the retinotopic maps were obtained in mrVista (Figure 1). Note the lack of statistically significant voxels in the foveal, non-stimulated visual field. In Figure 2, pRF centres from the coverage maps were integrated over the polar angle, a Kerned Density Estimation (KDE) was performed and the result plotted over the eccentricity for each stimulus type respectively. Further, figure 3 shows the first derivative of the estimated KDEs and the eccentricity value at their maximum. Their maxima are suitable for the prediction of the scotoma border and yield the following results:
(1) bar: 1.86°
(2) wedge and ring: 1.76°
(3) combination: 1.88°
It is shown, that the combination of both stimuli provides the highest peak in the derivative plot and therefor the most considerable pRF centre difference at the scotoma border. Hence, it is advantageous to combine the two stimuli in order to get profound scotoma size estimations from pRF mapping.
Conclusion
When using retinotopic mapping at ultra-high fields, it has been shown, that the scotoma size estimation yields significant values for both stimulation paradigms. However, the most distinct raise at the artificial scotoma borders can be measured when combining the two stimuli. With the choice of the right stimulation paradigm, retinotopic mapping can complement the possibility of scotoma estimations in patients beyond the conventional ophthalmologic methods, as microperimetry.